Variance is a measure of how much the data points in a dataset differ from the average (mean). It means that it is low variance if all your data points are very close to the mean, or if your data points are very far from the mean, it’s high.
What is Variance?
Variance quantifies the average of the squared differences between each data point and the mean of the dataset. It essentially tells us whether the data points are clustered closely around the mean (low variance) or are widely dispersed (high variance).
- High Variance: Indicates that data points are spread out from the mean, showing high variability.
- Low Variance: Indicates that data points are close to the mean, showing low variability.
Variance Formula
For a dataset with n values:

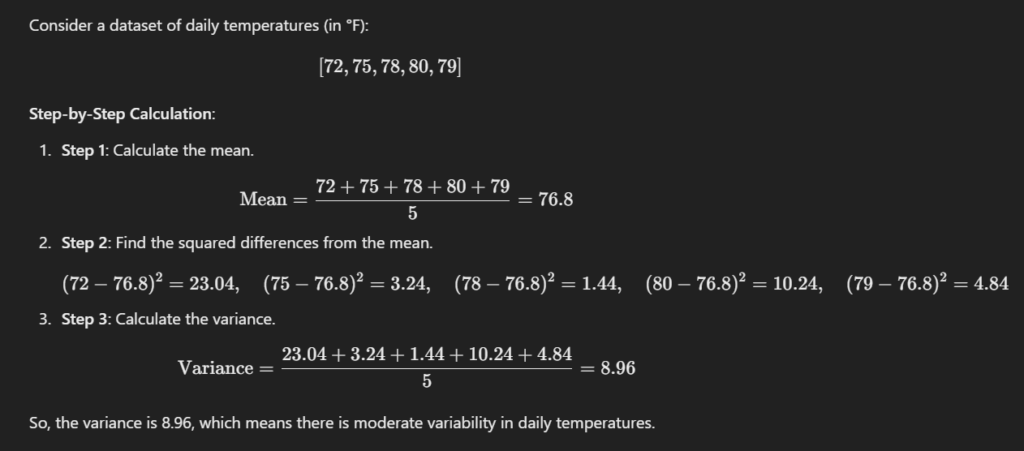
Calculating Variance: Example
Consider a dataset of daily temperatures (in °F):
Variance in Python
In Python, variance can be calculated using NumPy, which is a popular library for mathematical operations.
Python code for variance:
import numpy as np

# Example dataset: daily study hours of 5 students
study_hours = [2, 3, 5, 4, 6]

# Calculate the population variance (assuming we have data of all students)
population_var = np.var(study_hours, ddof=0)

# Calculate the sample variance (assuming this is just a sample of students)
sample_var = np.var(study_hours, ddof=1)

print("Study Hours Data:", study_hours)
print("Population Variance (whole group):", population_var)
print("Sample Variance (just a part of group):", sample_var)
Interpreting Variance in Data Science
Variance is not just a number; it tells a story about how data behaves. It’s used in many sectors, like:
- Finance: If the variance of stock returns is high, it means the stock price moves up and down a lot. Investors usually compare variance to decide which stock is safer or riskier.
- Manufacturing: If the variance in product dimensions is low, it means every item is almost the same size
- Quality Control: High variance in measurements might signal issues in production processes. Detecting high variance early can save money and reduce waste.
Variance and Standard Deviation
Variance is closely related to standard deviation because:
- Standard deviation is simply the square root of the variance and provides a direct measure of variability in the same unit as the data.
- While variance gives a squared result, standard deviation converts it back to the original unit of measurement, making it easier to interpret.
Visualizing Variance
Visualizing data variance can help identify data spread. For example, we can plot data with lines representing the mean and range.
Python code example for visualization of variance:
import matplotlib.pyplot as plt
import numpy as np

# Example dataset: marks of students in a test
marks = [45, 50, 55, 60, 65]
mean_marks = np.mean(marks)
variance = np.var(marks)

print("Mean Marks:", mean_marks)
print("Variance:", variance)

# Plot data points
plt.scatter(range(len(marks)), marks, color="green", label="Student Marks")

# Plot the mean line
plt.axhline(mean_marks, color='red', linestyle='--', label=f"Mean = {mean_marks:.2f}")

# Draw vertical lines from each point to the mean (to show spread)
for i, m in enumerate(marks):
    plt.plot([i, i], [mean_marks, m], color="gray", linestyle="dotted")

# Labels and title
plt.xlabel("Student Index")
plt.ylabel("Marks")
plt.title("Visualizing Variance in Student Marks")
plt.legend()
plt.show()
Output:

Applications of Variance in Data Science
In data science, variance is widely used to understand data distribution, detect outliers and refine algorithms. some applications include:
- Data Exploration: Variance helps summarize and understand data spread.
- Machine Learning: Algorithms analyze variance to tune models, especially for high-variance data.
- Risk Assessment: In finance, variance in asset returns supports risk assessment and decision-making.
Learn More About Data Science
- What is data in data science?
- What is a database table in data science?
- How to use Python in data science?
- Python DataFrame in data science?
- What are the functions in data science?
- What are statistics percentiles in data science?
Exercise: Variance in Daily Sleep Hours
A teacher surveyed 5 students about how many hours they sleep per night. The results are:
[6, 7, 5, 8, 6] (hours of sleep)
Tasks for Students:
- Find the mean (average) sleep hours.
- Calculate the variance of the dataset (step by step).
- Interpret the result: Do all students have similar sleeping patterns (low variance) or is there a big difference (high variance)?

M.Sc. (Information Technology). I explain AI, AGI, Programming and future technologies in simple language. Founder of BoxOfLearn.com.