What is a Function?
In data science, a Function is a reusable block of code that performs a specific task repeatedly, such as data cleaning, transformation, or statistical calculations, without requiring extra code.
Think of a function as a small machine you build yourself. Then, you give the machine some input, such as raw data. It performs a task, and then it gives you an output, just like a printed message, with the data cleaned.
Instead of writing the same lines of code again and again, we can wrap them inside a function and just call the function whenever we need it.
Basic Structure of a Function in Python
A Python function is defined using the def keyword, followed by the function name, parameters in parentheses and a colon. Here is the basic syntax of a function:
def function_name(parameters):
    # Code block
    return result
- def keyword used to define function.
- function name is the name that we give like clean_data, calculate_mean, etc.
- parameters refers to a optional values that we pass into the function.
- return keyword sends the result back.
Example code:
# A function to greet a user
def greet(name):
    return f"Hello, {name}! Welcome to Data Science."

print(greet("Peter"))
Output:
Hello, Peter! Welcome to Data Science.
- In this code, Peter is the input, and the function processes it and gives a customized message.
Example code of Data Science Context:
Let’s write a function to calculate the average (mean) of a list of numbers.
def calculate_mean(numbers):
    return sum(numbers) / len(numbers)

# Example dataset: ages of people
ages = [23, 27, 31, 29, 40]
print("Average Age:", calculate_mean(ages))
Output:
Average Age: 30.0
- Instead of writing sum(numbers)/len(numbers) every time, we now just call calculate_mean(ages).
Why Functions are Essential in Data Science?
- Reusability: Functions can be reused across multiple data analysis tasks, saving time and reducing the chance of errors.
- Automation: Functions allow data scientists to automate repetitive tasks, such as data cleaning or statistical calculations.
- Team Collaboration (Modularity): Functions break down complex processes into smaller, manageable pieces, so teammates can understand each part easily.
- Clarity: Functions break long code into small logical pieces, making it easier to understand.
- Debugging: If something goes wrong, you only need to fix the function instead of the same code in multiple places.
Common Data Science Functions
Here are some examples of functions commonly used in data science, covering tasks such as data cleaning, transformation and analysis.
1. Data Cleaning Functions
Now we write a function that handles the missing values.
import pandas as pd

# Function to fill missing values in a column with mean
def fill_missing_with_mean(df, column):
    mean_value = df[column].mean()
    df[column].fillna(mean_value, inplace=True)
    return df

# Sample DataFrame
data = {'Name': ['Alice', 'Bob', 'Charlie'], 'Age': [25, None, 30]}
df = pd.DataFrame(data)

print("Before Cleaning:")
print(df)

df = fill_missing_with_mean(df, 'Age')

print("\nAfter Cleaning:")
print(df)
Output:
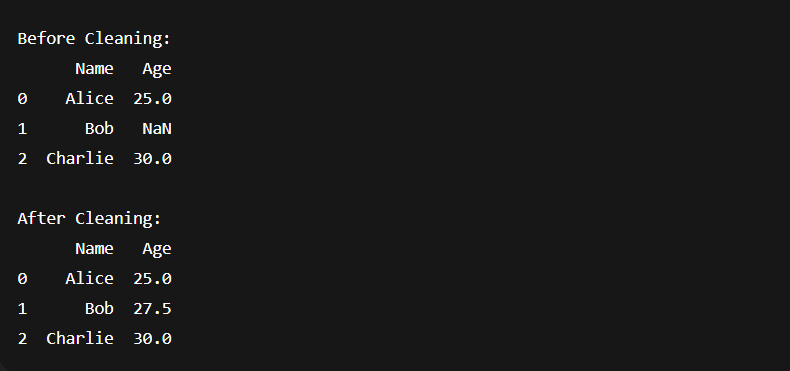
- Here, we created a custom cleaning function. If tomorrow you have 10 datasets, you don’t need to write this code again.
2. Transformation Functions
Data transformation functions are useful when we want to convert data into a suitable format for analysis.
For example, scaling numerical values, encoding categorical variables, or normalizing data are typical transformations.
Raw data isn’t ready for analysis in data science. For example:
- Salaries might range from ₹10,000 to ₹1,00,000, while ages might range from 18 to 60.
- If you use both directly in a machine learning model, the salary values will dominate because they are much larger than ages.
- For this problem, we apply transformation functions, so they reshape, scale, or encode data into a format that models and analysis tools can handle better.
Example: A function to normalize data using Min-Max scaling
import pandas as pd

# Function to normalize data using Min-Max scaling
def normalize_data(df, column):
    """
    Normalizes a given column in the DataFrame using Min-Max scaling.

    Formula:
        normalized_value = (value - min) / (max - min)
    """
    min_value = df[column].min()
    max_value = df[column].max()
    df[column + '_scaled'] = (df[column] - min_value) / (max_value - min_value)
    return df

# Example usage
data = {'Sales': [200, 300, 400, 500, 600]}
df = pd.DataFrame(data)
normalized_df = normalize_data(df, 'Sales')
print(normalized_df)
Output:
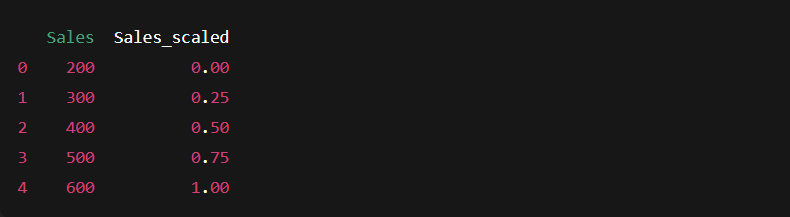
Real-Life Example:
Imagine you and your friend both score marks in different subjects:
- You score between 40-100.
- Your friend scores between 200-500.
If a teacher wants to compare both fairly, she rescales your marks to a common range (say 0-1). That’s exactly what normalization does for data!.
3. Statistical Analysis Functions
Statistics is like the backbone of data science. Before applying machine learning or advanced models, we first try to understand our data, and that’s where statistics comes in.
- Mean (Average) gives the “central” value of numbers.
- Median splits the data in half.
- Mode (Most frequent value) shows which value occurs most often.
Example: A function to calculate the mean, median, and mode
import pandas as pd

def analyze_data_trends(data):
    """
    Calculates mean, median, and mode manually
    (without using direct built-in shortcuts).

    Parameters:
        data (list): A list of numbers

    Returns:
        dict: Summary of statistics
    """
    # Sort data for median calculation
    sorted_data = sorted(data)
    n = len(sorted_data)

    # Mean
    mean_value = sum(sorted_data) / n

    # Median
    if n % 2 == 0:  # even number of elements
        median_value = (sorted_data[n//2 - 1] + sorted_data[n//2]) / 2
    else:  # odd number of elements
        median_value = sorted_data[n//2]

    # Mode (find most frequent value)
    freq = {}
    for num in sorted_data:
        freq[num] = freq.get(num, 0) + 1
    mode_value = max(freq, key=freq.get)

    return {
        "Mean": round(mean_value, 2),
        "Median": median_value,
        "Mode": mode_value
    }

# Example usage
sample_data = [10, 20, 20, 25, 30, 30, 30, 40]
stats_summary = analyze_data_trends(sample_data)
print("Statistical Summary:", stats_summary)
Output:
Statistical Summary: {'Mean': 25.63, 'Median': 27.5, 'Mode': 30}
Writing Custom Functions for Data Analysis
In data science, custom functions allow for highly specific analyses based on project requirements. Custom functions are especially useful for repetitive calculations or data transformations that may be unique to a dataset.
Example: Create a function to calculate a simple linear regression model
In this program code:
- The slope tells us how much y changes when x increases by 1.
- The intercept tells us the value of y when x = 0.
So when we got Slope = 0.6 and Intercept = 2.2, it means: y = 0.6x + 2.2
This equation predicts y values from x. For example:
- If x = 6, predicted y = 0.6*6 + 2.2 = 5.8.
Now, let’s create a unique custom function
import numpy as np

def custom_linear_regression(x, y):
    """
    Calculates slope and intercept for a simple linear regression model manually.

    Parameters:
    x (list or array): Independent variable values
    y (list or array): Dependent variable values

    Returns:
    dict: slope, intercept, and regression equation
    """
    x = np.array(x)
    y = np.array(y)

    # Step 1: Calculate means
    mean_x = np.mean(x)
    mean_y = np.mean(y)

    # Step 2: Calculate slope using covariance / variance
    numerator = np.sum((x - mean_x) * (y - mean_y))
    denominator = np.sum((x - mean_x) ** 2)
    slope = numerator / denominator

    # Step 3: Calculate intercept
    intercept = mean_y - slope * mean_x

    # Step 4: Build regression equation
    equation = f"y = {round(slope, 2)}x + {round(intercept, 2)}"

    return {
        "Slope": slope,
        "Intercept": intercept,
        "Equation": equation
    }

# Example usage
x = [1, 2, 3, 4, 5]
y = [2, 4, 5, 4, 5]

result = custom_linear_regression(x, y)
print(result)
Output:
{'Slope': 0.6, 'Intercept': 2.2, 'Equation': 'y = 0.6x + 2.2'}
Using Lambda Functions for Quick Data Operations
Lambda functions are one-line, anonymous functions that are useful for short, quick operations without defining a full function.
A lambda function is like a mini function you can write in one line without giving it a name. For example:
- Normally, we write a function like this:
def square(x):
    return x ** 2
- But with a lambda function, the same thing becomes:
lambda x: x ** 2
Example code:
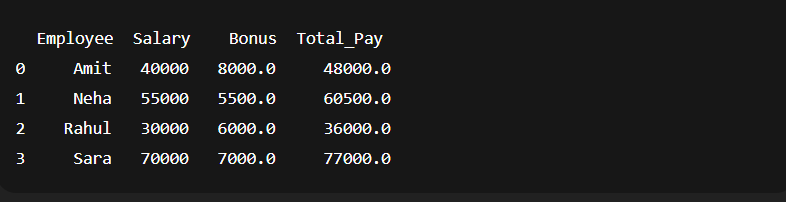
Suppose we have a company rule like, Employees earning less than 50,000 get a 20% bonus, and Employees earning 50,000 or more get a 10% bonus.
import pandas as pd

# Sample employee salary data
df = pd.DataFrame({
    'Employee': ['Amit', 'Neha', 'Rahul', 'Sara'],
    'Salary': [40000, 55000, 30000, 70000]
})

# Apply lambda to calculate bonus based on condition
df['Bonus'] = df['Salary'].apply(lambda x: x * 0.2 if x < 50000 else x * 0.1)

# Final salary after adding bonus
df['Total_Pay'] = df['Salary'] + df['Bonus']

print(df)
Output:
Learn More About Data Science
- What is data in data science?
- What is a database table in DS?
- How to use Python in Data Science?
- What is data preparation?
Exercise For Students
“Analyze Student Exam Data with Functions”
You are given exam data of a small coaching class. Each student has scores in Math, Science, and English. Your task is to write custom Python functions to analyze the data.
Data (You can start with this dictionary):
data = {
    "Name": ["Riya", "Arjun", "Sneha", "Kabir", "Meera"],
    "Math": [78, 45, 89, 56, 92],
    "Science": [88, 54, 76, 60, 85],
    "English": [70, 65, 80, 55, 90]
}
Tasks for Students:
- Create a function calculate_average(scores) that takes a list of scores and returns the average.
- Example: calculate_average([78, 88, 70]) → 78.6
- Create a function grade_student(avg) that assigns grades:
Aif average ≥ 80Bif average ≥ 60 and < 80Cif average < 60
- Write a function analyze_students(data) that:
- Loops through each student
- Calculates their average score using calculate_average()
- Assigns a grade using grade_student()
- Prints their Name, Average Score, and Grade
Expected Output (format idea, numbers depend on logic):
Riya → Average: 78.6 → Grade: B
Arjun → Average: 54.6 → Grade: C
Sneha → Average: 81.6 → Grade: A
Kabir → Average: 57.0 → Grade: C
Meera → Average: 89.0 → Grade: A
Try to write this code by yourself without any references.

M.Sc. (Information Technology). I explain AI, AGI, Programming and future technologies in simple language. Founder of BoxOfLearn.com.