Standard deviation is an important concept in statistics and data science. It’s used to measure the amount of variation or dispersion within a dataset.
Standard deviation tells us how much the data values move away from the average.
- Low SD – If all students in a class scored between 48–52 out of 100, the SD is low
- High SD – Values are spread out far from the average. If some students scored 10, some 50, and some 90, the SD is high
Standard deviation is a numerical value that indicates the stability or instability of your data.
Formula for Standard Deviation
For a dataset of n values:
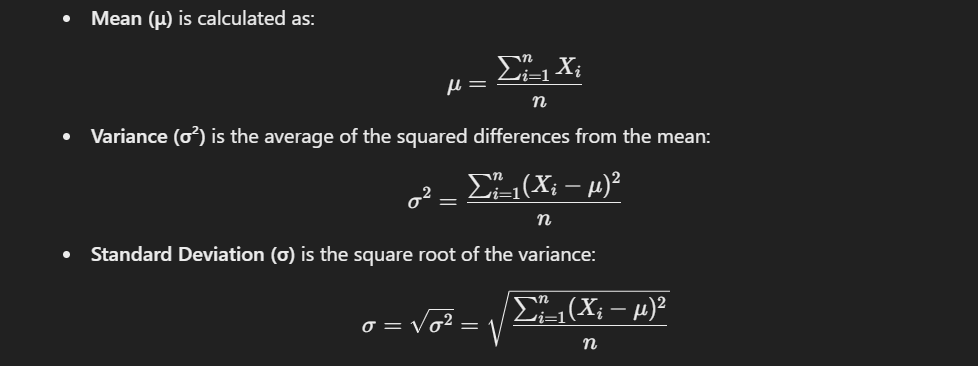
This formula gives us the standard deviation for a population. For a sample, we divide by n−1 instead of n.
Calculating Standard Deviation: Example
Consider the following dataset of test scores:
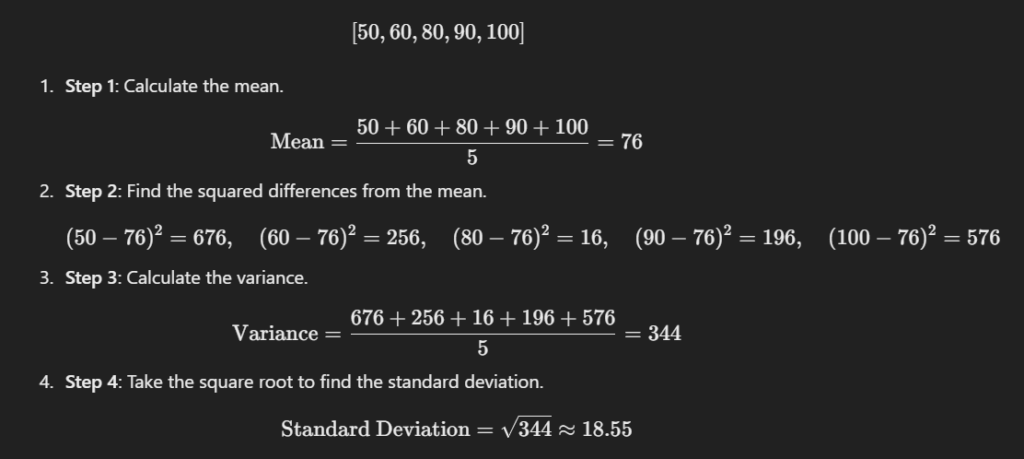
The standard deviation is approximately 18.55, indicating the extent to which the scores deviate from the mean.
Standard Deviation in Python
Python offers a straightforward way to calculate standard deviation using libraries like NumPy.
import numpy as np

# Data
data = [50, 60, 80, 90, 100]

# Standard deviation calculation
std_dev = np.std(data)
print("Standard Deviation:", std_dev)
Interpreting Standard Deviation in Data Science
Standard deviation helps in a stability checker for your data.
- Financial Risk: if SD is high, returns keep jumping up and down, so the investment is risky.
- Quality Control: if SD is low, every product is nearly the same size/weight, so production is reliable.
- Research Studies: if SD is small, experiments give almost the same results each time, so findings are trustworthy.
Standard Deviation and the Normal Distribution
First see the normal distribution scenario:
- 68% Rule → Most data (about two-thirds) stays close to the mean (within ±1 SD).
- 95% Rule → Almost all data (about 19 out of 20 values) fall within ±2 SD.
- 99.7% Rule → Practically the entire dataset is inside ±3 SD.
This “68-95-99.7 rule” is useful because it tells us how much data we can expect around the average without having to check every single value.
Visualizing Standard Deviation
Visualization can help illustrate the spread of data. Below is a Python example for plotting data with its standard deviation.
import matplotlib.pyplot as plt
import numpy as np

# --- Step 1: Simple dataset (exam scores of 8 students) ---
scores = [45, 50, 55, 60, 65, 70, 80, 90]

# --- Step 2: Calculate mean and standard deviation manually ---
mean_score = sum(scores) / len(scores)

# formula: sqrt( Σ(x - mean)² / n )
squared_diff = [(x - mean_score) ** 2 for x in scores]
std_dev = (sum(squared_diff) / len(scores)) ** 0.5

# --- Step 3: Plot histogram of scores ---
plt.hist(scores, bins=8, color="skyblue", edgecolor="black", alpha=0.7)

# --- Step 4: Show mean and standard deviation on graph ---
plt.axvline(mean_score, color="red", linestyle="--", linewidth=2, label=f"Mean = {mean_score:.1f}")
plt.axvline(mean_score + std_dev, color="green", linestyle="--", linewidth=2, label=f"Mean + 1 SD = {mean_score+std_dev:.1f}")
plt.axvline(mean_score - std_dev, color="green", linestyle="--", linewidth=2, label=f"Mean - 1 SD = {mean_score-std_dev:.1f}")

# --- Step 5: Labels & Title ---
plt.title("Visualizing Mean and Standard Deviation (Student Scores)")
plt.xlabel("Scores")
plt.ylabel("Number of Students")
plt.legend()
plt.show()
Output of this code:
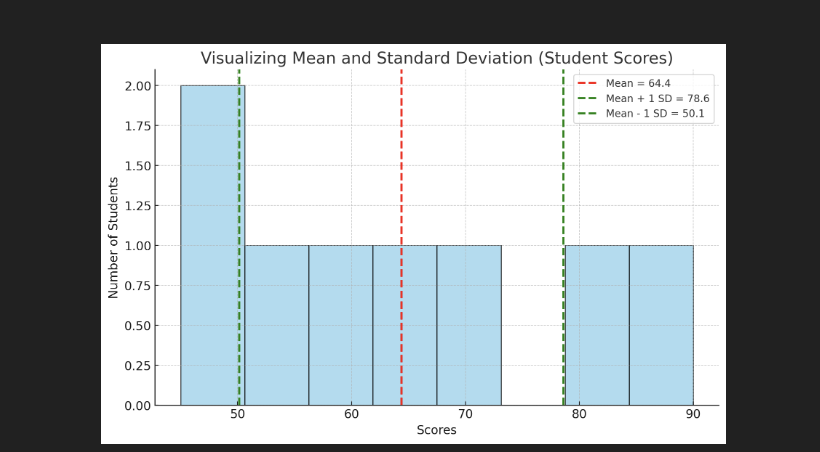
- The blue bars show the distribution of student scores.
- The red dashed line marks the mean (average score).
- The green dashed lines show one standard deviation above and below the mean.
Using Standard Deviation to Detect Outliers
Example: Detecting Outliers in Temperature Data
import numpy as np

# --- Step 1: Exam marks of students ---
marks = [45, 48, 50, 52, 49, 95, 47, 51, 46, 100]

# --- Step 2: Calculate mean and standard deviation ---
mean_marks = sum(marks) / len(marks)   # simple mean
squared_diff = [(x - mean_marks) ** 2 for x in marks]
std_dev = (sum(squared_diff) / len(marks)) ** 0.5

# --- Step 3: Detect outliers (more than 2 SD away from mean) ---
outliers = []
for m in marks:
    if abs(m - mean_marks) > 2 * std_dev:
        outliers.append(m)

print("Mean Marks:", round(mean_marks, 2))
print("Standard Deviation:", round(std_dev, 2))
print("Outliers Detected:", outliers)
Learn More About Data Science
- What is data in data science?
- What is a database table in data science?
- How to use Python in data science?
- Python DataFrame in data science?
- What are the functions in data science?
- What are statistics percentiles in data science?
Standard Deviation Exercise For Students
A group of friends tracked how many hours they spent on their phones daily for one week:
Day 1 = 3 hours
Day 2 = 2.5 hours
Day 3 = 4 hours
Day 4 = 6 hours
Day 5 = 3.5 hours
Day 6 = 2 hours
Day 7 = 8 hours
Your Task:
- Find the mean daily phone usage.
- Calculate the standard deviation of the data.
- Comment: Does the value on Day 7 (8 hours) look like an outlier compared to the rest of the week?

M.Sc. (Information Technology). I explain AI, AGI, Programming and future technologies in simple language. Founder of BoxOfLearn.com.